
First we will look at offensive statistics. With our original analysis, Scoring (calculated by dividing total runs by games played) had the highest offensive correlation of 61.6%. Of fourteen additional offensive statistics examined, none surpassed Scorings correlation with Winning Percentage. On Base Percentage (OBP) came a close second with a correlation of 61.3%. Also, if we add Slugging to OBP and also add additional total bases as a result of stolen bases (OPS+SB), we find a statistic with a correlation of 60.7%.
Deriving Stolen Bases as Total Bases (SBTB) is best explained by example. New Mexico State successfully stole on 60 out of 68 base attempts. In other words, 60 singles effectively became doubles, but eight singles were effectively eliminated because the batter was erased by being caught stealing. There are then 60 8 = 52 SBTB for New Mexico State. Interestingly, when adding SBTB to most traditional statistics that account for total bases gained, their correlation went up. Notably, Slugging Percentage correlation went up 4% and OPS correlation went up 2.4%.
Moving on to pitching statistics, ERA was king in the initial analysis with a correlation of 58.8%. I examined four additional pitching statistics, and found two that had higher correlation than ERA: Runs given up per game (with a correlation of 70.46%, the only strong correlation I have yet found), and Walks plus Hits per Inning Pitched (WHIP). WHIP had a correlation of 63.2%.
Finally, five new fielding statistics were calculated and compared to our standard from the initial analysis, Fielding Percentage, which had a correlation of 37.9%. I defined Defensive Efficiency (DEFF) as the number of hits surrendered plus the number of errors made and divided that by the number of chances the defense had to make a put out, but did not include the put outs recorded because of a strike out. The intent was to take the pitcher and her strikeouts out of the equation and just look at how good a teams defense was in getting outs when the ball was hit. DEFF had a correlation of 43.6%. If strikeouts are added to DEFF to make a combined fielding/pitching statistic called DEFF+K, its correlation jumps up to 57.9%.
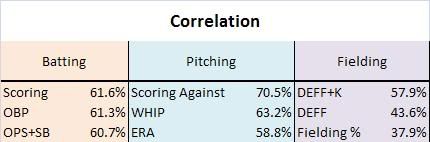
The top 5 correlated statistics in batting, pitching and fielding are listed in the table to the right.
What conclusions can be drawn from this analysis? Well, it appears that pitching is a little more correlated to winning than batting, and batting more correlated to winning than fielding. Also, On Base Percentage seems to be a better predictor of winning percentage than OPS, even when OPS is adjusted with successful stolen bases. Finally, determining a teams ability to turn batted balls into outs (DEFF) is a better measurement of defense than the traditional Fielding Percentage.
BellaOnline Softball Subject List: Coach´s Box, Health & Medical, History of Softball, International Softball, Organizations, Parents , Professional Softball, Reviews, Rules & Regulations, Scorekeeping, Stats & Analysis, Travel Ball |