All other things being equal, it is better to get out of an inning quickly, as measured by number of batters or number of pitches. Though a Softball pitcher does not wear down nearly as quickly as a baseball pitcher, fatigue can still be a factor, particularly if multiple games are played. Fatigue can not only effect a pitcher, but extra time out on the field if it is cold and rainy or blazing hot can wear down defensive players as well. Therefore, an approach that gets the most outs in the least amount of time is desirable.
In the previous article, I mentioned David Gassko’s article (The Kazmir Conundrum) which postulates that there is almost no difference in the number of pitches if a baseball pitcher is a PtC or strikeout pitcher. Here, we’re going to conduct a similar analysis for Softball. In Gassko’s article, it is determined that a strikeout in baseball averages 4.8 pitches, a walk averages 5.5 pitches. Otherwise, when a ball is hit, that at bat averages 3.3 pitches. In addition to Gassko’s model, we’re going to factor in double plays and errors, as one would suspect that a PtC pitcher would get more of both from their defense than a strikeout pitcher. We’ll assume that 2009 was an average year for both Major League baseball and College Softball.
“Batting Average for Balls Put in Play”, or BABIP, is basically calculated the same ways a Batting Average is except At Bats that resulted in strikeouts or home runs are not counted. It is used to determine how effective a defense is in converting batted balls into outs (it is assumed that a defense has no chance to make a play on a home run or a strikeout). Year in and year out in Major League baseball, BABIP averages right around 0.300, which means that about 30% of balls put in play result in a base hit.
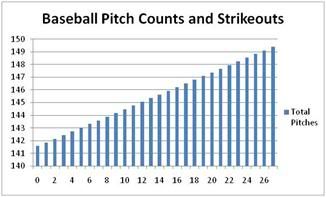
Baseball’s overall fielding percentage on balls put in play (in other words, taking strikeouts and home runs out of the fielding percentage equation) was 0.981, so about 2% of the time a ball put in play resulted in an error. Of balls that were hit into outs, double plays occurred about 5% of the time. Modifying Glassko’s model to include errors and double plays results in the graph to the right. It tabulates the expected number of pitches based on the number of strikeouts thrown in a 9 inning game. Glassko assumed that the pitcher would throw 3 walks and give up a home run, so we include these assumptions in the modified model as well. He also assumed a very good defense that allowed a BABIP of 0.290 instead of the Major League average of 0.300. If we assume a BABIP of 0.300, the pitcher with 0 strikeouts makes about 2 more pitches than the above graph, but the number of pitches with 27 strikeouts remains the same.
When we add errors and double plays, a baseball PtC pitcher does tend to throw less pitches than a strikeout pitcher, but only by a modest amount (there’s only a difference of about 7 pitches between the extremes of 0 and 27 strikeouts). Now, let’s apply the same analysis to College Softball.
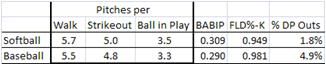
For Softball, the number of pitches per at bat is similar to baseball. A strikeout averages 5 pitches, a walk averages 5.7 pitches, and balls that are hit take 3.5 pitches. The BABIP for Softball was 0.309 in 2009, a couple of ticks higher than the Major League average. Softball’s fielding percentage minus strikeouts was 0.949, quite a bit lower than baseball’s 0.981, and double plays only occurred about 2% of the time that an out was recorded. These differences are summarized in the table to the right.
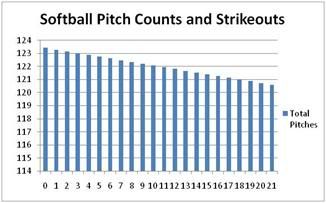
When you plug in the Softball numbers for a 7 inning game, the results are pretty eye-opening, and shown in the graph to the right. In Softball, a PtC pitcher actually will end up pitching more pitches than a strikeout pitcher!! This confirms the conventional wisdom of Softball – that pitching rules, and if you have a dominant strikeout pitcher, you are well on your way to a winning season. In Softball, a strikeout pitcher’s team is spending more time in the dugout eating seeds and hitting than a PtC pitcher’s team. Interesting…
Finally, to the right is a table containing the College Softball Division 1 pitchers with the most wins in 2009. The average number of strikeouts in the 2009 season was 5.4 strikeouts a game. By now, it should not be surprising
that 10 of the 11 top pitchers struck out more batters than average. Only one,
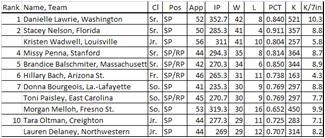 Hillary Bach from Arizona State, could be said to lean toward PtC. She’s a freshman, so it will be interesting if her strikeouts per game increase as her career progresses (At the end of the regular season of her sophomore year, she averaged 4 Ks/7 innings).
 It is pretty clear that, given a choice, PtC should not be a Softball team’s pitching philosophy. We don’t care much about pitch counts for a Softball pitcher anyway (unless you are a Little League Fast Pitch pitcher, which is a topic for another day). However, what happens if you don’t have a dominant pitcher and have to employ PtC? Next, we will look at how to implement PtC in Fast Pitch Softball if forced to.
BellaOnline Softball Subject List: Coach´s Box, Health & Medical, History of Softball, International Softball, Organizations, Parents , Professional Softball, Reviews, Rules & Regulations, Scorekeeping, Stats & Analysis, Travel Ball |