Contributors to Winning PCT in College Softball

The NCAA College Softball statistics page allows one to find the top 200 Division I teams during the 2009 season in ten team statistical categories: Team Batting Average, Double Plays per Game, Doubles per Game, Team Earned Run Average, Team Fielding Percentage, Home Runs per Game, Team Scoring, Team Slugging Percentage, Stolen Bases per Game, and Triples per Game. This article will attempt to discover if there is correlation between any one of these ten team statistics and a team’s winning percentage. We will use a linear regression analysis to compare each team statistic individually with team winning percentage. A team statistic that that does have significant correlation with winning percentage is likely to be a performance area on which coaching staffs should focus.
Correlation is the amount of that a team’s winning percentage can be “explained” by the team statistic. For example, a correlation of 50% means that half of the winning percentage can be explained by that statistic. A correlation greater that 70% is considered “strong”, less than 30% is considered “weak”, and otherwise considered “moderate”. Also, it is important to note that correlation does not necessarily imply causality. There may be other factors not considered in the NCAA statistics that contribute to a team’s winning percentage.
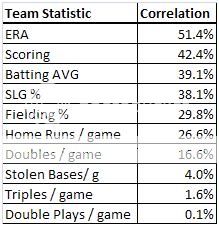 The table to the right indicates the correlation between the top 200 teams of that particular statistic and their winning percentage. No team statistic given has a strong correlation with winning percentage, and only Earned Run Average (ERA), Scoring, Batting Average, Slugging Percentage (SLG %) and Fielding Percentage (if rounded up) have moderate correlations. Still, there are a couple of very interesting conclusions we can draw.
Anyone familiar with the Fast Pitch Softball knows how valuable good pitching is, so it should be no surprise that ERA has at least a moderate correlation with a team’s winning percentage. What I find intriguing is that, on balance, it seems to be more important to prevent runs (ERA) than to score runs (Scoring) at the college level. This concept may require more digging in further articles. For example, On-Base Percentage (OBP) and OBP plus Slugging (OPS) are two statistics that are used in mainstream baseball analysis. To me, an examination of these other statistics would be valuable and I am curious to see where their correlation would fall in our table above.
Another remarkable conclusion we can draw from the NCAA statistics is that Batting Average has a slightly higher correlation to winning percentage in College Softball than Slugging Percentage. In baseball, this would be considered heresy as Batting Average has largely fallen out of favor and been replaced by OBP and OPS. A similar linear regression analysis conducted on American League Baseball (I chose American League Baseball and excluded National League Baseball because the designated hitter in the American League is roughly analogous to the designated player in Fast Pitch Softball) as we did above shows that Slugging Percentage is three times more correlated to winning percentage than Batting Average. I suspect that this reflects that Fast Pitch Softball is much more a “little ball” game than baseball has become. Again, an area for exploration in future articles.
Finally, conducting a multiple regression analysis of the NCAA data (basically a combination of all the ten statistics into one formula to determine which ones are most “significant” – the linear regression discussed above took each statistic alone and compared it to winning percentage) results in the conclusion that ERA, Fielding Percentage, and Scoring are most significant to predicting winning percentage. Go figure! A team with good pitching, good fielding, and good offense will tend to win! Sometimes statistics is just a way to verify the common sense we already know. That we came to this conclusion does indicate that our statistical approach makes sense, and that we may want to pay attention to the other conclusions we draw from the data.
Correlation is the amount of that a team’s winning percentage can be “explained” by the team statistic. For example, a correlation of 50% means that half of the winning percentage can be explained by that statistic. A correlation greater that 70% is considered “strong”, less than 30% is considered “weak”, and otherwise considered “moderate”. Also, it is important to note that correlation does not necessarily imply causality. There may be other factors not considered in the NCAA statistics that contribute to a team’s winning percentage.
The table to the right indicates the correlation between the top 200 teams of that particular statistic and their winning percentage. No team statistic given has a strong correlation with winning percentage, and only Earned Run Average (ERA), Scoring, Batting Average, Slugging Percentage (SLG %) and Fielding Percentage (if rounded up) have moderate correlations. Still, there are a couple of very interesting conclusions we can draw.Anyone familiar with the Fast Pitch Softball knows how valuable good pitching is, so it should be no surprise that ERA has at least a moderate correlation with a team’s winning percentage. What I find intriguing is that, on balance, it seems to be more important to prevent runs (ERA) than to score runs (Scoring) at the college level. This concept may require more digging in further articles. For example, On-Base Percentage (OBP) and OBP plus Slugging (OPS) are two statistics that are used in mainstream baseball analysis. To me, an examination of these other statistics would be valuable and I am curious to see where their correlation would fall in our table above.
Another remarkable conclusion we can draw from the NCAA statistics is that Batting Average has a slightly higher correlation to winning percentage in College Softball than Slugging Percentage. In baseball, this would be considered heresy as Batting Average has largely fallen out of favor and been replaced by OBP and OPS. A similar linear regression analysis conducted on American League Baseball (I chose American League Baseball and excluded National League Baseball because the designated hitter in the American League is roughly analogous to the designated player in Fast Pitch Softball) as we did above shows that Slugging Percentage is three times more correlated to winning percentage than Batting Average. I suspect that this reflects that Fast Pitch Softball is much more a “little ball” game than baseball has become. Again, an area for exploration in future articles.
Finally, conducting a multiple regression analysis of the NCAA data (basically a combination of all the ten statistics into one formula to determine which ones are most “significant” – the linear regression discussed above took each statistic alone and compared it to winning percentage) results in the conclusion that ERA, Fielding Percentage, and Scoring are most significant to predicting winning percentage. Go figure! A team with good pitching, good fielding, and good offense will tend to win! Sometimes statistics is just a way to verify the common sense we already know. That we came to this conclusion does indicate that our statistical approach makes sense, and that we may want to pay attention to the other conclusions we draw from the data.
BellaOnline Softball Subject List: Coach´s Box, Health & Medical, History of Softball, International Softball, Organizations, Parents , Professional Softball, Reviews, Rules & Regulations, Scorekeeping, Stats & Analysis, Travel Ball |
This site needs an editor - click to learn more!
You Should Also Read:
Revisiting Contributors to Winning PCT
Home Run Trends in College Softball
Related Articles
Editor's Picks Articles
Top Ten Articles
Previous Features
Site Map
Content copyright © 2023 by Don McKay. All rights reserved.
This content was written by Don McKay. If you wish to use this content in any manner, you need written permission. Contact
BellaOnline Administration
for details.