Revisiting Contributors to Winning PCT

In the earlier article that examined the correlation of various College Softball Division I team statistics to that team’s winning percentage, I used the data provided by the NCAA Division I Softball statistics page, which lists the top 200 teams in each of 10 categories. Once I processed the data on that page and reported on it, I became aware that the data on the NCAA stats page is biased, or skewed, toward successful teams. This article uses an unbiased data set and compares it with the original conclusions.
An easy way to illustrate that the NCAA Stats page data is biased is to look at the aggregate Winning percentage of, say, the top 200 batting average teams. If this were an unbiased estimate, we would expect the average winning percentage of those 200 teams to be around 0.500. Instead, they have an average winning percentage of 0.554. The probability that such a sample of teams would be unbiased is less than 5%. I wanted to run the same analysis using unbiased data, which should produce results that are truer than the first time.
In order to derive an unbiased data set, I went to all 272 Division I College Softball web sites to copy the Softball statistics from their web sites (as far as I know, there is no other way to get this data directly). Of those 272 teams, 225 had statistics from 2009 available – why almost 20% of the teams either did not have a web site or did not have 2009 statistics posted is a question for another day. These 225 teams had an average winning percentage of 0.505 (there was over a 40% chance that an unbiased collection of teams would produce the same result), so the sample can be considered more unbiased than the stats from the NCAA page. In fact, we could expect all Division I programs to have an average winning percentage a little bit above 0.500 because they play some games against Div II opponents, and we would expect a Division I program to defeat a Division II program more often than not.
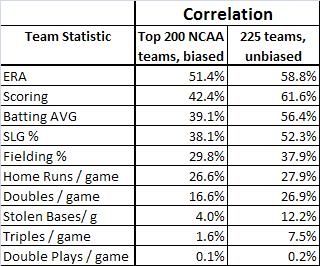 The correlations to team winning percentage are shown in the table to the right (again, correlations greater than 70% are considered strong, correlations less than 30% are considered weak, and all others are considered moderate). Comparing the previous biased analysis with the unbiased analysis yields the following conclusions:
1) Scoring becomes the highest correlated statistic to winning percentage in the unbiased data (it was second strongest in the biased data). This makes more sense, as runs have to be scored to win the game. Indeed, the biased result of ERA being the most highly correlated statistic was a surprise to me (and one of the reasons why I started investigating whether the NCAA 200-team data was biased in the first place).
2) The statistics with the top five correlations all become stronger using the unbiased data (yet all remain of moderate strength).
3) Batting Average still outperforms Slugging Percentage, and by a larger margin than with the biased information -- heresy to fantasy baseball players, but apparently not so for Softball teams.
Perhaps the most interesting result when repeating the initial analysis with the unbiased data occurs when we conduct a multiple regression looking at all 10 statistics data (basically a combination of all the ten statistics into one formula to determine which ones are most “significant” – the linear regression discussed above took each statistic alone and compared it to winning percentage). With the biased data, we found that ERA, Fielding Percentage and Scoring were the only three significant contributors to winning percentage. However with the unbiased data, a multiple regression analysis dictates that ERA, Fielding Percentage, Scoring, Slugging Percentage, Doubles per game, Home Runs per game, and Double Plays per game have some bearing on winning percentage. Furthermore, ERA, Doubles per game, Home Runs per game, and Double Plays per game tend to have a negative bearing on winning percentage.
We would expect ERA to have a negative correlation on winning percentage, as the lower one’s ERA, the better. Likewise, it makes sense that Double Plays should have a negative bearing on winning percentage. Having a large number of opportunities for a double play means that there are a lot of runners on base, and the more runners on base, the higher chance that they will score. What to make of the negative relation between doubles and home runs per game and winning percentage, though? It could merely be a statistical Red Herring, and that data for future years will not show such a relationship.
I have a guess, but only further analysis will reveal the real answer (if there is one). Fortunately, I now have an unbiased data set with which I can continue to investigate.
An easy way to illustrate that the NCAA Stats page data is biased is to look at the aggregate Winning percentage of, say, the top 200 batting average teams. If this were an unbiased estimate, we would expect the average winning percentage of those 200 teams to be around 0.500. Instead, they have an average winning percentage of 0.554. The probability that such a sample of teams would be unbiased is less than 5%. I wanted to run the same analysis using unbiased data, which should produce results that are truer than the first time.
In order to derive an unbiased data set, I went to all 272 Division I College Softball web sites to copy the Softball statistics from their web sites (as far as I know, there is no other way to get this data directly). Of those 272 teams, 225 had statistics from 2009 available – why almost 20% of the teams either did not have a web site or did not have 2009 statistics posted is a question for another day. These 225 teams had an average winning percentage of 0.505 (there was over a 40% chance that an unbiased collection of teams would produce the same result), so the sample can be considered more unbiased than the stats from the NCAA page. In fact, we could expect all Division I programs to have an average winning percentage a little bit above 0.500 because they play some games against Div II opponents, and we would expect a Division I program to defeat a Division II program more often than not.
The correlations to team winning percentage are shown in the table to the right (again, correlations greater than 70% are considered strong, correlations less than 30% are considered weak, and all others are considered moderate). Comparing the previous biased analysis with the unbiased analysis yields the following conclusions:1) Scoring becomes the highest correlated statistic to winning percentage in the unbiased data (it was second strongest in the biased data). This makes more sense, as runs have to be scored to win the game. Indeed, the biased result of ERA being the most highly correlated statistic was a surprise to me (and one of the reasons why I started investigating whether the NCAA 200-team data was biased in the first place).
2) The statistics with the top five correlations all become stronger using the unbiased data (yet all remain of moderate strength).
3) Batting Average still outperforms Slugging Percentage, and by a larger margin than with the biased information -- heresy to fantasy baseball players, but apparently not so for Softball teams.
Perhaps the most interesting result when repeating the initial analysis with the unbiased data occurs when we conduct a multiple regression looking at all 10 statistics data (basically a combination of all the ten statistics into one formula to determine which ones are most “significant” – the linear regression discussed above took each statistic alone and compared it to winning percentage). With the biased data, we found that ERA, Fielding Percentage and Scoring were the only three significant contributors to winning percentage. However with the unbiased data, a multiple regression analysis dictates that ERA, Fielding Percentage, Scoring, Slugging Percentage, Doubles per game, Home Runs per game, and Double Plays per game have some bearing on winning percentage. Furthermore, ERA, Doubles per game, Home Runs per game, and Double Plays per game tend to have a negative bearing on winning percentage.
We would expect ERA to have a negative correlation on winning percentage, as the lower one’s ERA, the better. Likewise, it makes sense that Double Plays should have a negative bearing on winning percentage. Having a large number of opportunities for a double play means that there are a lot of runners on base, and the more runners on base, the higher chance that they will score. What to make of the negative relation between doubles and home runs per game and winning percentage, though? It could merely be a statistical Red Herring, and that data for future years will not show such a relationship.
I have a guess, but only further analysis will reveal the real answer (if there is one). Fortunately, I now have an unbiased data set with which I can continue to investigate.
BellaOnline Softball Subject List: Coach´s Box, Health & Medical, History of Softball, International Softball, Organizations, Parents , Professional Softball, Reviews, Rules & Regulations, Scorekeeping, Stats & Analysis, Travel Ball |
This site needs an editor - click to learn more!
You Should Also Read:
Contributors to Winning PCT in College Softball
Home Run Trends in College Softball
Related Articles
Editor's Picks Articles
Top Ten Articles
Previous Features
Site Map
Content copyright © 2023 by Don McKay. All rights reserved.
This content was written by Don McKay. If you wish to use this content in any manner, you need written permission. Contact
BellaOnline Administration
for details.